Mission
This project turns 2,000 shipment records, warehouse activity, and carrier performance into a decision layer that helps operations teams reduce failures, improve on-time delivery, and tighten cost control.
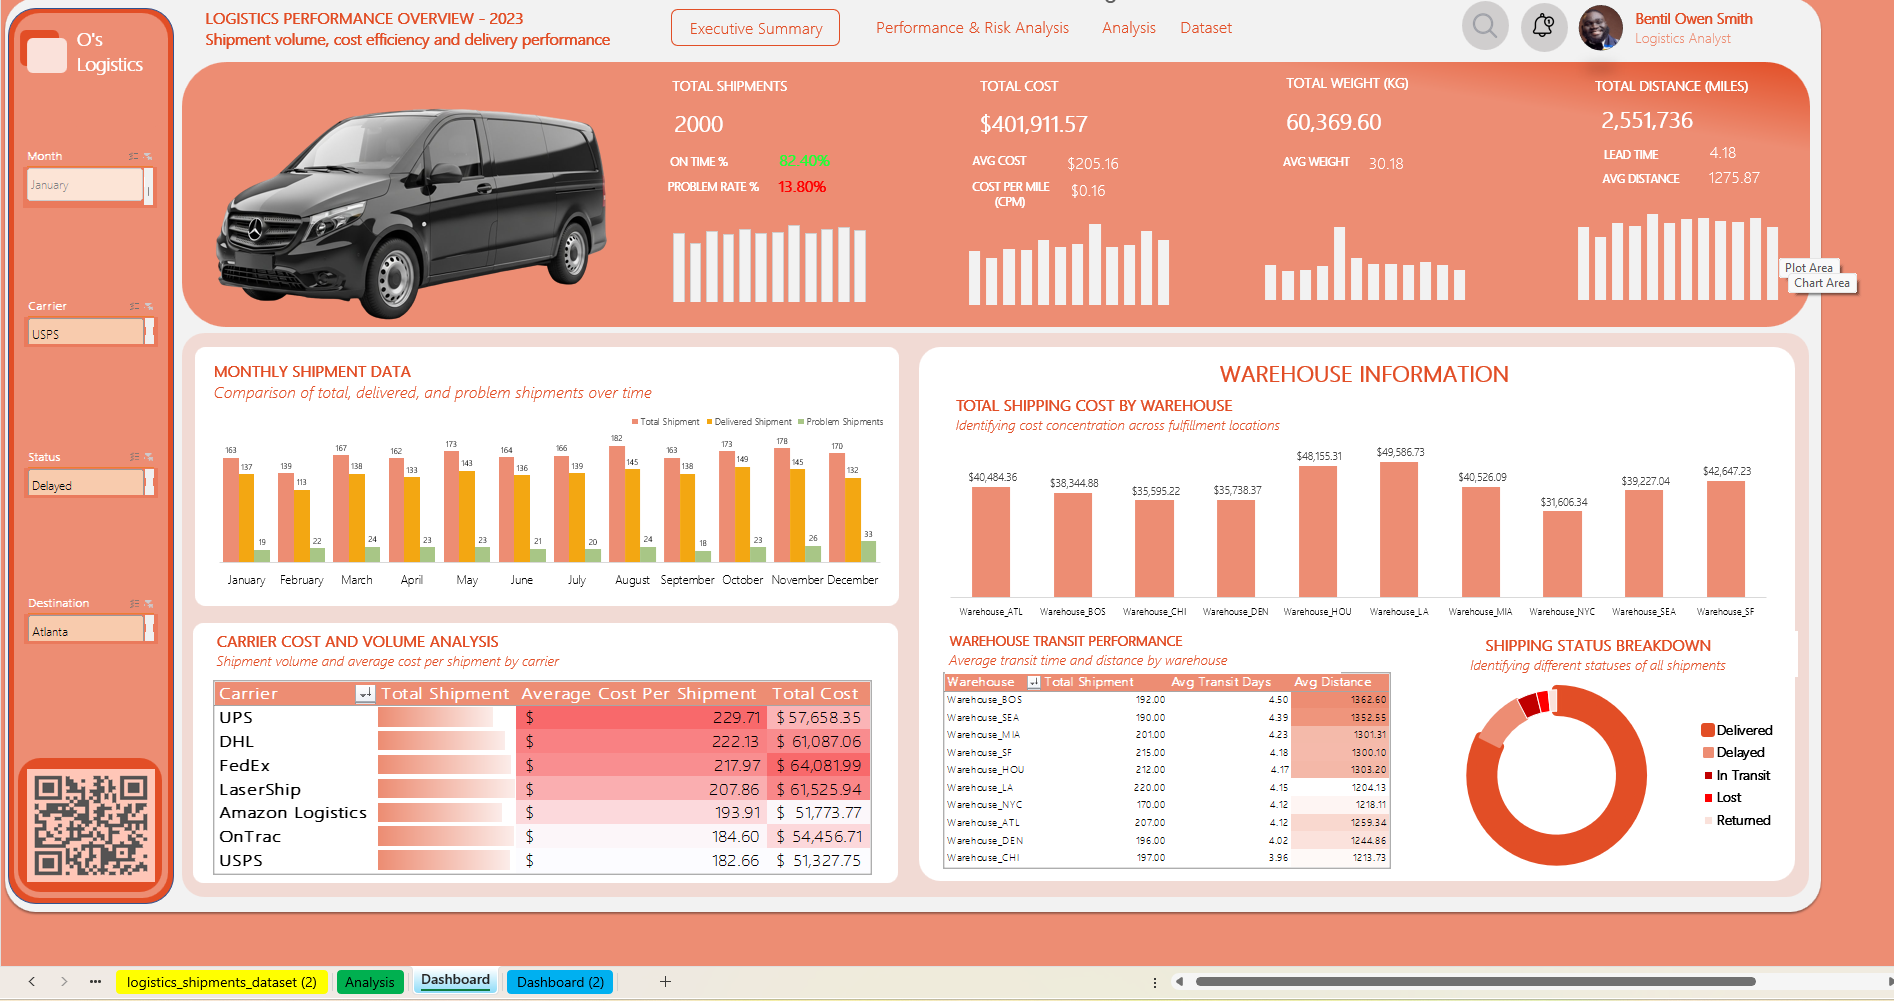
Excel Dashboard
A logistics decision dashboard built to expose delivery failures, benchmark warehouse performance, and reduce avoidable transport cost across a simulated nationwide network.
Mission
This project turns 2,000 shipment records, warehouse activity, and carrier performance into a decision layer that helps operations teams reduce failures, improve on-time delivery, and tighten cost control.
Tools
Key findings
Project intent
This project turns 2,000 shipment records, warehouse activity, and carrier performance into a decision layer that helps operations teams reduce failures, improve on-time delivery, and tighten cost control.
Impact
Tools used